")


Asset Class Annual Returns (NAV) 2013 – 2023
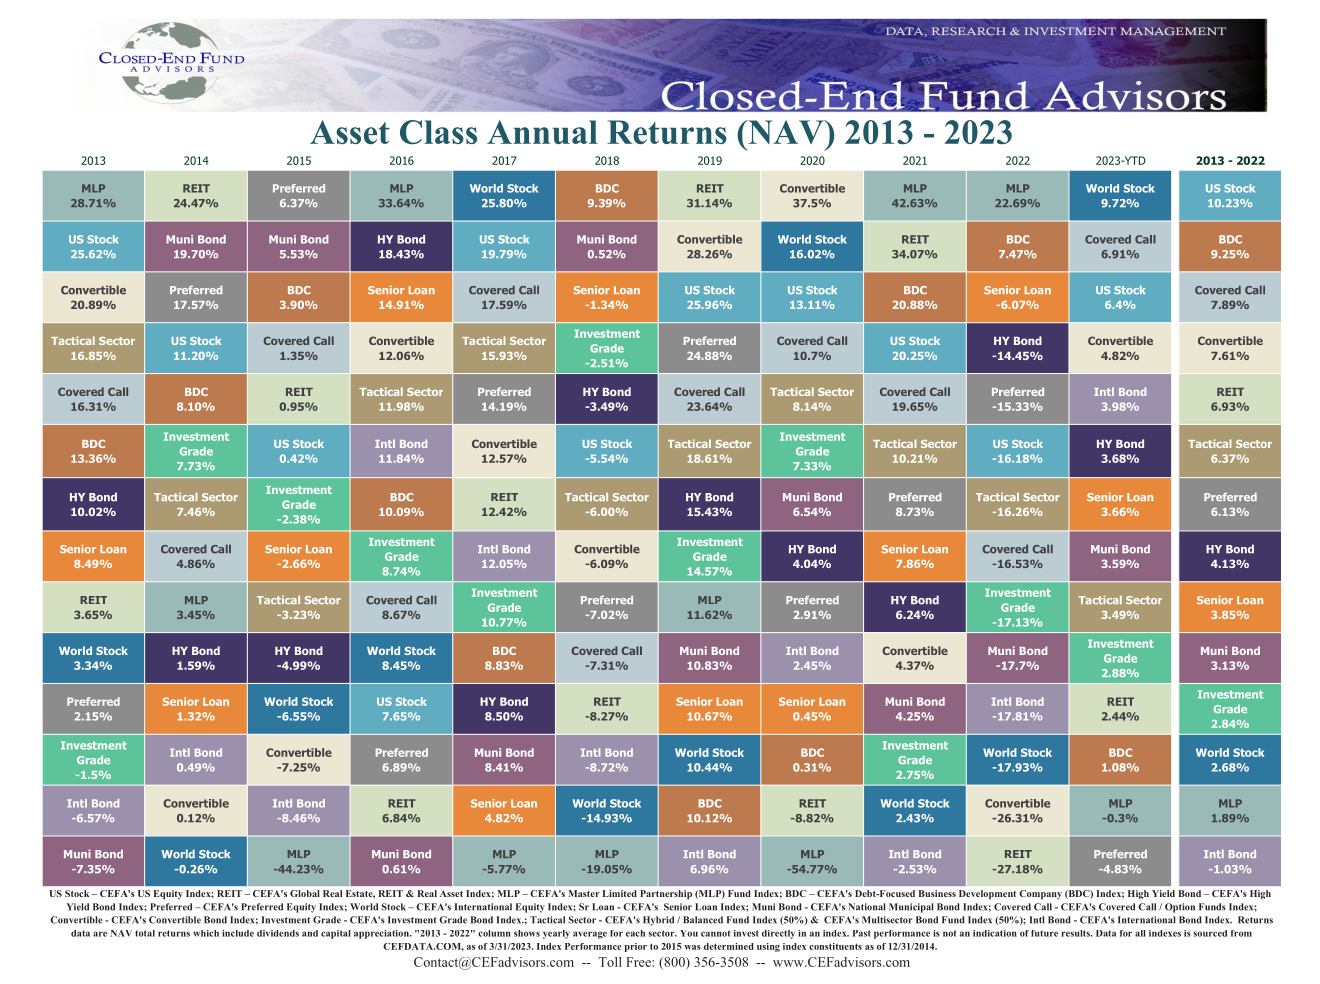 Download a two page PDF with historical sector performance for most key CEF groupings as well as historical discounts data for the same sectors. We developed the piece as a simple way to explain to investors the difference in NAV movements vs. discounts movements over the past 10 years and give them context vs. current levels. Last update: 03/31/2023.
10 Year CEF NAV TR and Market Price TR Correlation Tables
 Download a two page PDF with historical 10 Year NAV total return correlations for the 14 major CEF sectors and for 10 year market price total return correlations. We developed the piece as a simple way to explain to investors the difference in NAV movements and to help foster proper portfolio diversification. Giving context vs. the current environment. It acts as a nice companion for the discount and asset class tables. Last update: 6/30/2019.